“You can have data without information, but you cannot have information without data.” — Daniel Keys Moran
Last summer, we talked about the Chemical Safety Board’s compilation of incident data since their reporting rule became effective in March 2020. Companies experiencing catastrophic releases that result in one or more fatalities, one or more in-patient hospitalizations, or property damage in excess of $1,000,000 must report them to the CSB, which compiles them and shares that summary. Reporting got off to a slow start (3.75 incidents per month during the first 8 months), but since then, CSB’s summary shows that it has maintained an average rate of about 7 incidents per month.
Except for December 2022.
In December, U.S. facilities had to report 18 incidents to the CSB. Two involved fatalities, 5 involved serious injuries, and 14 involved substantial property damage. Was December 2022 atypical, or is a dramatic December spike in the number of CSB reportable incidents just something we should expect?
Was December 2022 Atypical?
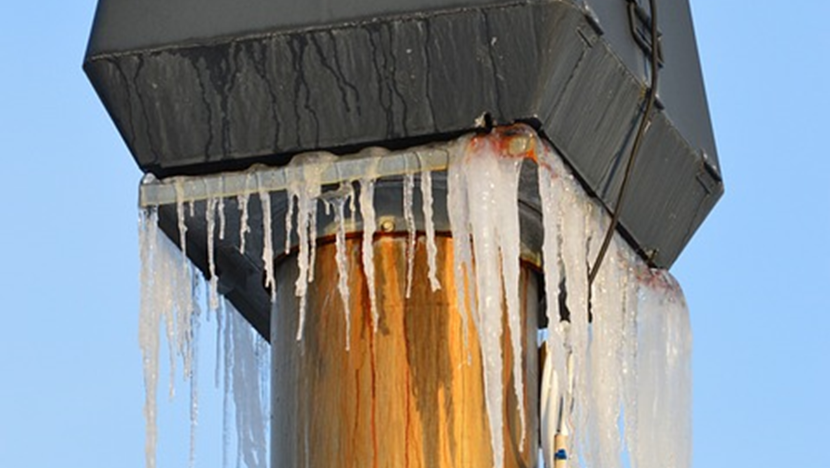
In the press release announcing CSB’s most recent compilation of data, Steve Owens, the Chairperson of the CSB was quoted: “With record low temperatures across much of the country this past weekend, the CSB saw an unprecedented uptick in reportable events. This may be partly due to the unique safety challenges posed by cold weather, but regardless, companies need to heighten their focus on safe operations and recognize that taking important precautionary actions, like winterization, can help prevent major chemical accidents.”
December is not the only cold month of year, though, and this is not the first winter that the CSB includes in its summary. Going back to 2020, here is what the CSB has compiled in the way of significant incidents:
- December 2020 8 incidents
- January 2021 2 incidents
- February 2021 10 incidents
- December 2021 4 incidents
- January 2022 7 incidents
- February 2022 9 incidents
- December 2022 18 incidents
Yes. December 2022 was “unprecedented.” Perhaps the spike in December was the result of better reporting than in previous years. Perhaps the spike was due to an unusually early cold weather system that blanketed most of the country. Or perhaps the spike in December was a harbinger of things to come. As a harbinger, it only does any good if we heed it and prepare accordingly in the months and years to come.
Are There Other Harbingers?
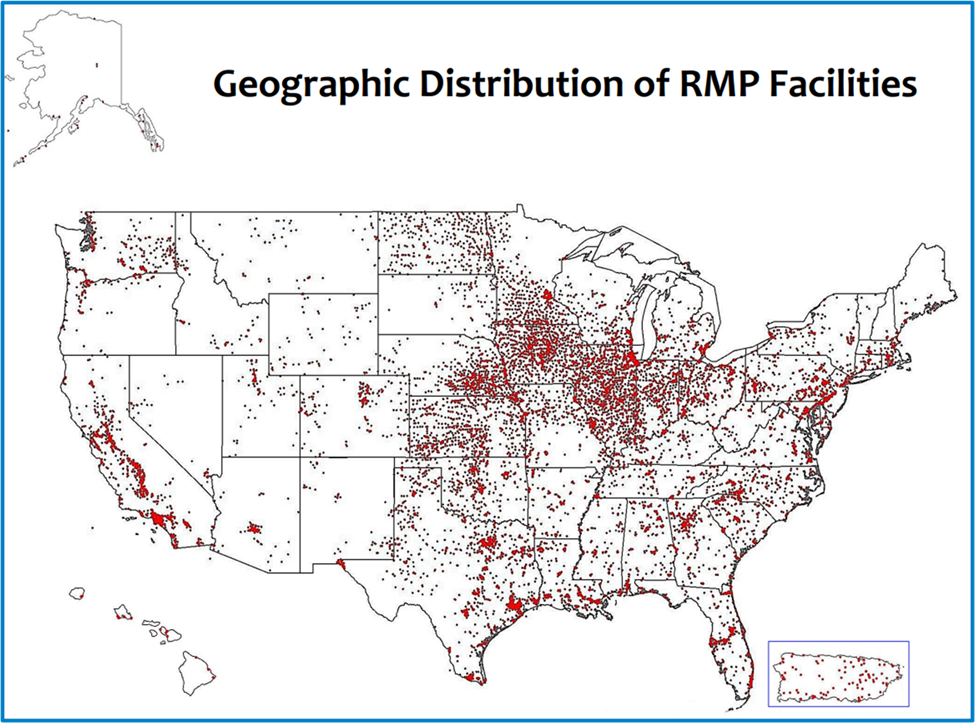
A map showing the geographic distribution of RMP Facilities presented by the USEPA makes it clear that every state and territory in the United States is the site of facilities that could experience catastrophic releases that result in one or more fatalities, one or more in-patient hospitalizations, or property damage in excess of $1,000,000.
During the first nineteen months of reporting to the CSB, 14 states avoided any incidents that qualified. Some, like Alaska, Hawaii, Rhode Island, and Vermont are not host to much chemical industry, and are still not the source of any reportable incidents. Others, like New Jersey, Mississippi, and Wisconsin, which are host to significant chemical industry, have now made the list of states with reportable incidents. So has Washington state.
Six months more of reporting has brought the number of states that have not suffered a CSB-reportable incident down to 10. The trend suggests that before too much longer, every state and territory in the Unites States is going to end up on the CSB list of significant incidents. Especially when acknowledging that the potential to have these incidents is not limited to chemical manufacturing. These incidents also occur in the agriculture, energy, food and beverage, and water and wastewater industry sectors.
Texas and Louisiana
Texas and Louisiana, at 30 incidents each, accounted for almost 40% of all the incidents on the CSB list of significant events during the period from March 2020 through June 2022. Since then, Texas experienced 15 more incidents and Louisiana experienced 8 more incidents. Together, those two states accounted for over 35% of all reported incidents in the last six months.
Is this because the chemical industry is especially unsafe in those states? Or because so much of the chemical industry is in those states?
The top five chemical-producing states are Texas, Louisiana, New Jersey, California, and Illinois.
- Texas produces about 31% of the chemicals manufactured in the U.S. and was home to 20% of the CSB-reportable incidents. Texas’ incident rate is noticeably better than the size of its chemical industry would predict.
- Louisiana produces about 6½% of the chemicals manufactured in the U.S. and was home to 17% of the CSB-reportable incidents. It has had almost three times as many incidents as the size of its chemical industry would predict
- New Jersey produces about 5¼% of the chemicals manufactured in the U.S. and was home to only 1, or .45%, of the CSB-reportable incidents. New Jersey has had an order-of-magnitude fewer incidents than the size of its industry would predict.
- California produces about 5% of the chemicals manufactured in the U.S. and was home to 2.2% of the CSB-reportable incidents. California has had half the incidents that the size of its chemical industry would predict
- Illinois produces about 4% of the chemicals manufactured in the U.S. and was home to 5.8% of the CSB-reportable incidents. Illinois’ incident rate is running a little ahead of the rate that the size of its chemical industry would predict.
So, the size of the chemical industry in each state is not a good predictor of how many CSB-reportable incidents it will have. The chemical industry in some states is much safer than the size of their industry would predict, for instance Texas, California, and New Jersey. On the other hand, there are other states that are not as safe as the size of their chemical industry would predict. For instance, Louisiana and Illinois. Something else is at play.
Turning Data Into Information
Until recently, the information we got from the CSB consisted of reports and videos on individual incidents. With every report and video that the CSB releases, our industry learns how to be safer. Sure, each report and video contained lots of data, but more importantly each contained information and recommendations that we can apply to our own facilities. Each, however, was just one look.
The data that the CSB is now collecting and sharing on serious incidents has the potential to be even more valuable, because it can provide us with a much broader view. Data is not information, though. Data needs to be studied and analyzed before it becomes information, and it takes information to figure out how to be safer.
What’s At Play?
A sudden spike in the number of CSB-reportable incidents in December 2022 is data. Problems with winterization, if a thorough analysis of the data bears that out as the cause, will be valuable information. Especially if that information allows us to avoid having this past December become a harbinger of things to come.
What else is at play? The importance of this data will only become apparent when we can use it to see trends and follow where they are going. The data is available. Let’s all look at it. We don’t have to wait on the CSB to spot those trends. We should be checking ourselves to see what’s at play.