
“For everything there is a season, and a time for every purpose under heaven. A time to be born and a time to die, a time to plant, and a time to harvest.” — Ecclesiastes 3:1-2
When October rolls around and plans for Halloween are being made, thoughts often turn to autumn as a time when nature completes one more cycle in the circle of life. Thoughts also turn to our own mortality. It makes me think of work-related fatalities.
While many aspects of life are seasonal, are work-related fatality rates? Fortunately, the Bureau of Labor Statistics (BLS) publishes that data and posts it to their web site. [If you want to have a look for yourself, go the Miscellaneous CFOI data tables and look at the “all worker profiles” for 1992-2002 and for 2003-2018.]
Are Work-Related Fatalities Seasonal?
The chart in Figure 1 shows the average fatality rate (fatalities per day) for all workers in the United States for the 27-year period from 1992 through 2018. Clearly, the number of work-related fatalities per day depends on the season. During the period from November through mid-May, the daily rate averages 13.9 fatalities per day. During the period from mid-May to the end of October, the daily rate jumps up to an average of 16.8 fatalities per day. This second period, from mid-May through the end of October is recognized as “The Construction Season”, although the construction season is shorter in colder climates and is year-round in Florida.
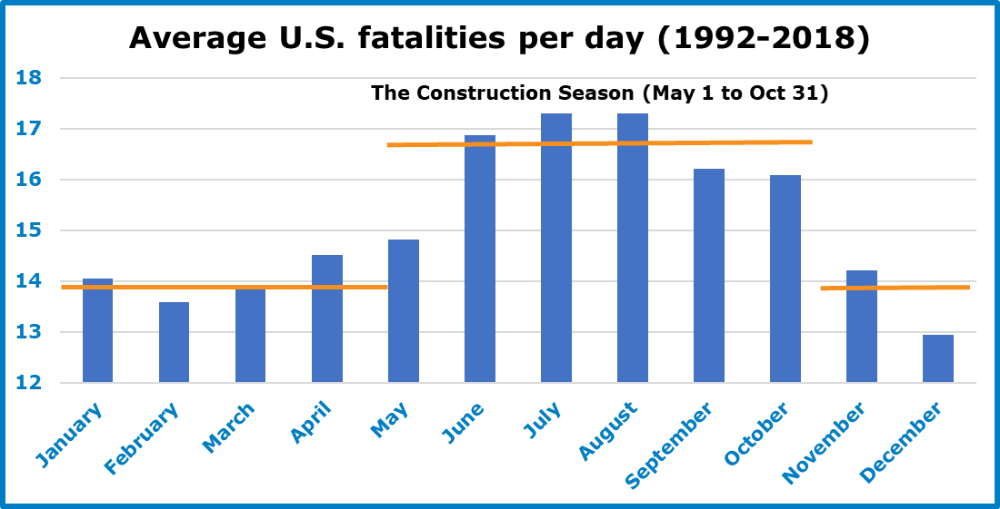
Figure 1. Average U.S. daily work-related fatalities, by month (BLS)
What causes this seasonal fatality rate? To a large extent, it is associated with the seasonal employment rates, which varies by industry. Retail is seasonal, but as you might expect, it shows a sharp peak during the winter holiday shopping season, followed by a deep trough in January. Other industry segments with seasonal employment include government, leisure, and mining, each with modest seasonality. No seasonal industry segment has as much impact on national employment as construction.
The plots in Figure 2 show how the seasonal pattern of employment varies between three industries: construction, manufacturing, and retail, from 1983 through 2016. Construction and retail follow the same pattern of employment year after year. Manufacturing, which includes the chemical process industries? Not so much.
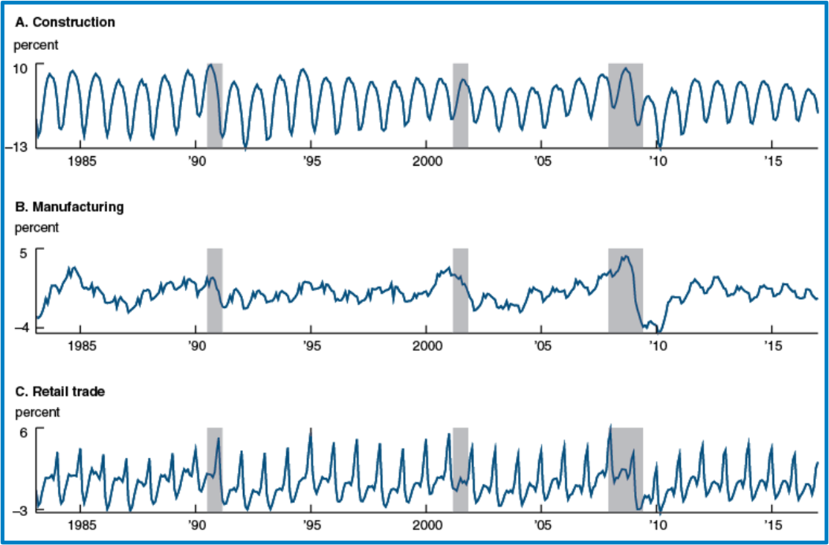
Figure 2. Employment for selected industries – 1983-2016 (Geremew and Gurio, 2018)
The Federal Reserve Bank of Chicago published a paper in 2018 that allows them to characterize this seasonal pattern of employment with a single value called Seasonality, Seasi. For construction, Seasi = 6.59, and for retail, Seasi = 2.17. Every other segment of the economy has less Seasonality.
Overall, employment in the U.S. has a Seasonality, Seasi, of 0.88.
Manufacturing, of which the chemical process industries are a part, is barely seasonal at all. It has a Seasonality, Seasi, of 0.63.
All of this means that after taking construction into consideration, which accounts for almost 20% of work-related fatalities, the daily fatality rate in the rest of the economy remains relatively constant on a month-to-month basis.
In general, then, there is no season of death in the U.S. workplace, except for construction, and for construction, it is not autumn or winter.
What About Day-to-Day Fatality Rates?
Over the period from 1992 through 2018, the average daily work-related fatality rate was 15.2 fatalities per day.
Most people, when asked which of the seven days of the week has the lowest work-related fatality rate, correctly guess that it is Sunday. After all, this is a day off for much of the U.S. workforce. If people aren’t working, the number of work-related fatalities should be less. The work-related fatality rate for the period from 1992 through 2018 was 7.2 fatalities per Sunday, less than half the average daily rate.
When asked to continue, most people correctly guess that the day of the week with the second lowest work-related fatality rate is Saturday. They reason that more people work on Saturday than on Sunday, but not as many who work on weekdays. Again, when fewer people are working, the number of work-related fatalities should be less. The work-related fatality rate for the period from 1992 through 2018 was 10.8 fatalities per Saturday, just over two-thirds the average daily rate.
So, weekends, with fewer people working, have fewer work-related fatalities per day. No surprise.
Weekdays
There is a surprise when considering weekdays, however. When asked to predict the profile of work-related fatalities through the workweek, many people guessed that the same number of people would be working on each weekday, so the number of people killed on the job would be same on each weekday as well.
Others thought the profile would look more like a suspension bridge: a high rate on Mondays because people were still districted by thoughts of the weekend just passed, a high rate on Fridays because people were distracted by thoughts of their upcoming weekend, and lower rates during the midweek, with Wednesday having the lowest weekday fatality rate of all.
The surprise is that the profile is much the opposite, as shown in Figure 3. Friday, which most people guessed would have more work-related fatalities per day than any other day of the week, is typically the weekday with the lowest. In 20 out of 27 years, Friday was the weekday with the lowest fatality rate, although it was never as low as on the weekend. In 4 of the remaining 7 years, Friday was the weekday with the second lowest fatality rate. TGIF—Thank Goodness It’s Friday—takes on a whole new meaning in light of this data.
Wednesday, which many people anticipate having the lowest work-related fatality rate of the workweek, instead has the highest. Not much, but statistically significant. In 14 of the 27 years covered by the BLS data, it was the highest for that year, and in the remaining 13 years, Wednesday had the second highest work-related fatality rate of the workweek in 6 years. Wednesday is a hump day in the worst possible sense.
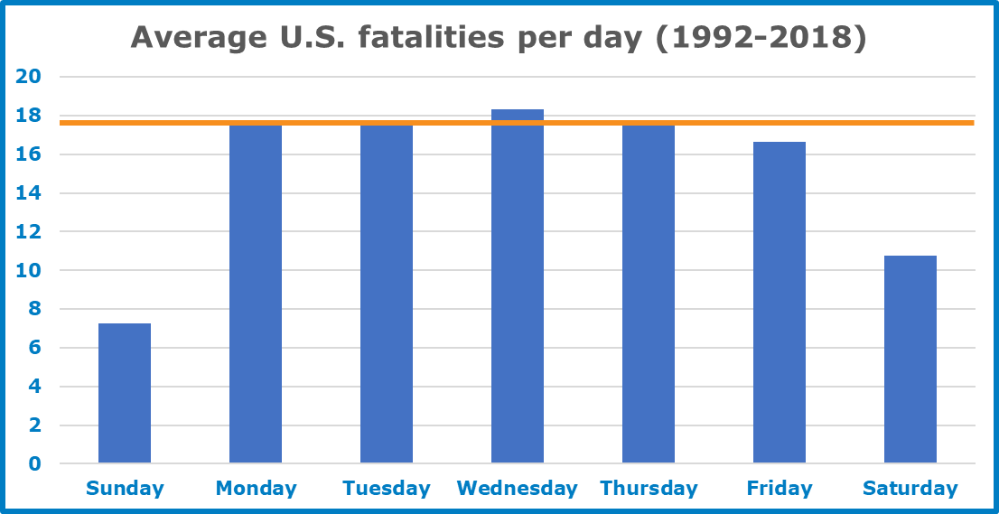
Figure 3. Average U.S. daily work-related fatalities, by day (BLS)
Wednesday’s Child is Full of Woe
It doesn’t appear that there are any seasonal differences in fatality rates unless you work in construction. For the chemical process industries, though, it would be wise to continue addressing seasonal topics: hypothermia and slip hazards from ice in the winter, dehydration and heatstroke in the summer, and severe weather in the spring (tornadoes) and autumn (hurricanes). But for the chemical process industries, there is no “season of death.”
Weekdays are a different story. There is an old nursery rhyme, “Monday’s Child,” that was first published in 1838 by A.E.Bray in her book, Traditions of Devonshire. It includes the line “Wednesday’s child is full of woe.” Originally believed to give anxious parents’ a hint about what the future held for their offspring, it gives us a hint as well about the future of workers’ health and safety.
Does the day of the week make a difference? Not a big one. But, because Wednesday is the day most likely to result in a fatal work-related incident, perhaps it would be best if we held our weekly safety meetings at the beginning of Wednesday’s shifts, rather than on other day of the week.