“My first customer was a lunatic. My second had a death wish.” — Karl Benz
We want to get safer.
We invest enormous resources in making the world a safer place. Sometimes, though, it doesn’t seem like we’re making much progress, especially when we’ve just experienced a catastrophic event. Instead, it seems like we just keep making the same mistakes over and over.
Is it true? Are we getting safer? What does the data say?
The Law of Conservation of Recklessness
The premise of the Law of Conservation of Recklessness is that people adapt their behavior to the risk they perceive. When they perceive they are at greater risk, they behave with greater caution; when they perceive they are at less risk, they behave with less caution—more recklessly. This suggests that we need to make people safer but not make them feel any safer.
One area that gets a lot of attention is vehicle safety. Automakers, insurance companies, non-profits like the National Safety Council, and local, state, and federal agencies all work tirelessly to make it safer to drive. This includes addressing the safety of vehicles themselves, as well as the safety of the roads on which we operate. The Congressional Research Service, in its report on Federal Highway Traffic Safety Policies noted that while driver behavior, vehicle design, road design, and traffic management all have a role in improving driving safety, “some analysts note that road design and traffic management arrangements often allow, or even encourage, driver error or misbehavior, and so play a larger role in crashes than is often recognized.”
The History of Automobile Safety
A recent piece by Marcus Lu for the Visual Capitalist showed a history of automobile safety. It tried to link improvements over the past 60 years to ten specific safety innovations. Some, like seat belts (2-point and 3-point) and back-up cameras, require the active participation of drivers to improve safety, and so could be expected to be subject to the Law of Conservation of Recklessness. Others, like third brake lights, dual front airbags, and antilock braking systems, act with no participation from drivers, so could be expected to improve safety with no counteracting risk compensation.
The data shows no such distinction.
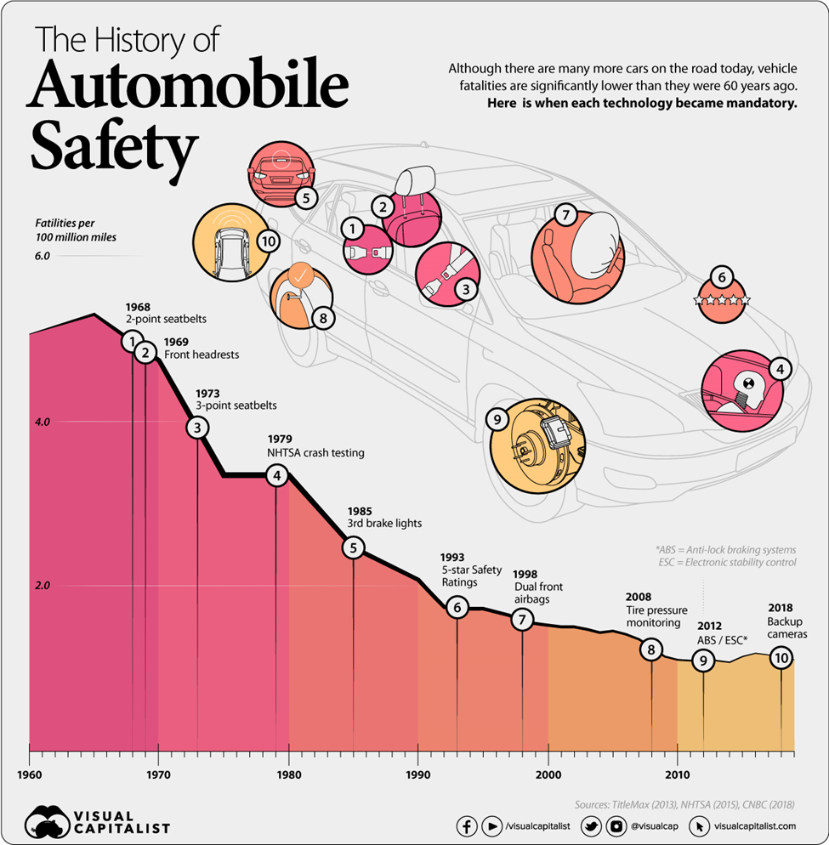
There are three noteworthy aspects of this graphic, as suggestive as it is. The first is that it would be easy for someone to look at it and wonder if we had reached the limit of our ability to improve the safety of driving somewhere around 2010. The second is about the choice of important events to show. What about Ralph Nader’s publication of Unsafe at Any Speed in 1965? Or the widespread introduction of Jersey barriers in the late 1960’s and early 1970’s? Or setting the national speed limit to 55 mph in 1974 and then repealing it in 1995?
The most noteworthy aspect of this graphic, though, is the suggestion that progress on automobile safety did not begin until 1965.
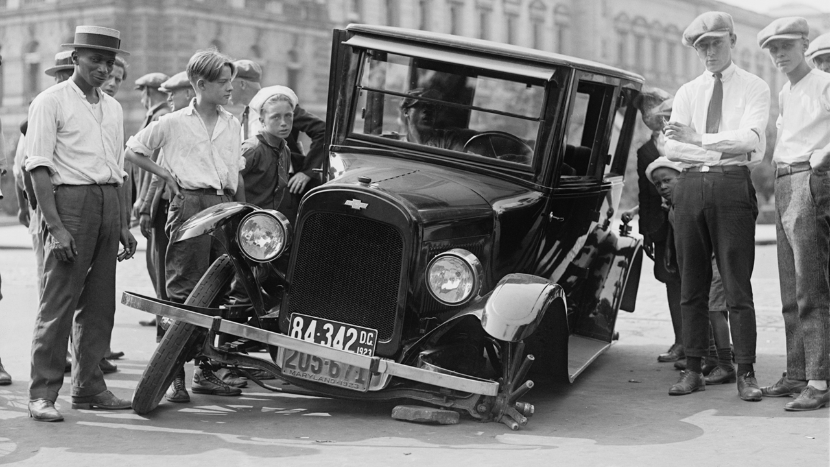
Before Seatbelts
The effort to improve automobile safety began long before Ralph Nader complained about vehicle safety. It began soon after the use of automobiles began. Karl Benz patented the first motor car in 1886 and was immediately concerned about its safe use.
The National Highway Traffic Safety Administration (NHTSA) shares traffic fatality data going back to 1899. There were 26 traffic fatalities in the United States that year. In 1901, Connecticut became the first state to establish motor vehicle speed limits: 12 mph in urban areas and 15 mph in rural areas. By 1909, the number of traffic fatalities in the U.S. was up to 1,174.
In 1909, the city of Detroit became so concerned about traffic safety that the courts and police decided that regulation was necessary. Bill Loomis reports in The Detroit News that they decided to “set the speed limit to match the pace of horse-drawn wagons, at 5 miles per hour, to make the streets as safe as they were before cars.”
How safe are horses? Our analysis of a recent study of fatalities and injuries of equestrians conducted by Dr. Janet Sorli suggests that the fatality rate is 75 fatalities per 100 million miles traveled by horseback.
By 1921, the first year for which the NHTSA reports traffic fatality rates, the motor vehicle traffic fatality rate was down to 24.08 fatalities per 100 million miles traveled. There is certainly scatter in the data, but the motor vehicle traffic fatality rate has been falling exponentially ever since.
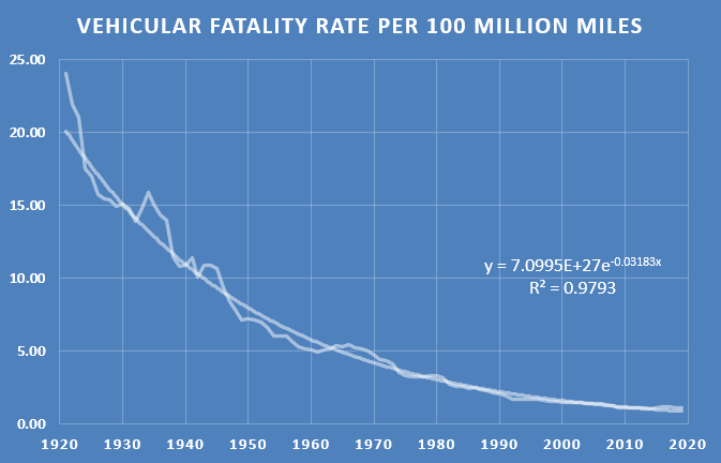
Clearly, efforts to improve vehicle safety began long before the Department of Transportation was formed in 1966 and charged with improving the safety of the nation’s vehicles and roadways. That is not to say that the efforts of the DoT are unimportant, but that they are part of a continuous effort to improve vehicle safety.
Also note that while it appears from the graph that improvements came at a more predictable rate beginning in the late 1970’s, that it is really an artifact of the scale of the graph. Here is the same period, but at a finer scale.
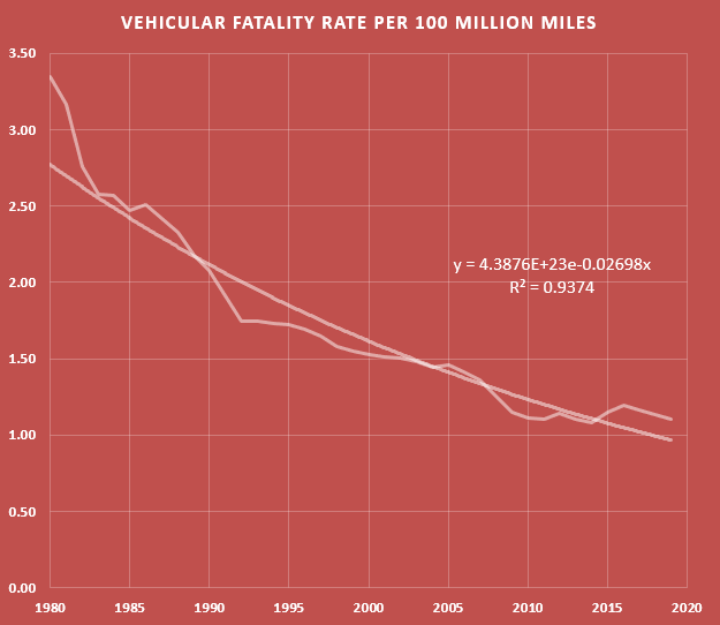
What these graphs illustrate is that we are in a period where year-to-year comparisons are meaningless. Any given year may be above the trend line or below the trendline; trying to assign a cause for one or the other in a particular year is like studying a coin to see why it came up heads or tails on a particular flip. While continuous improvement is the result of many incremental changes, it can only be measured over a larger scale of time.
Safety In the Chemical Process Industries
What does vehicle safety tell us about safety in the chemical process industry (CPI)?
It tells us that rather than looking at changes from one day to the next, or one month to the next, or even one year to the next, we should be looking for overall trends.
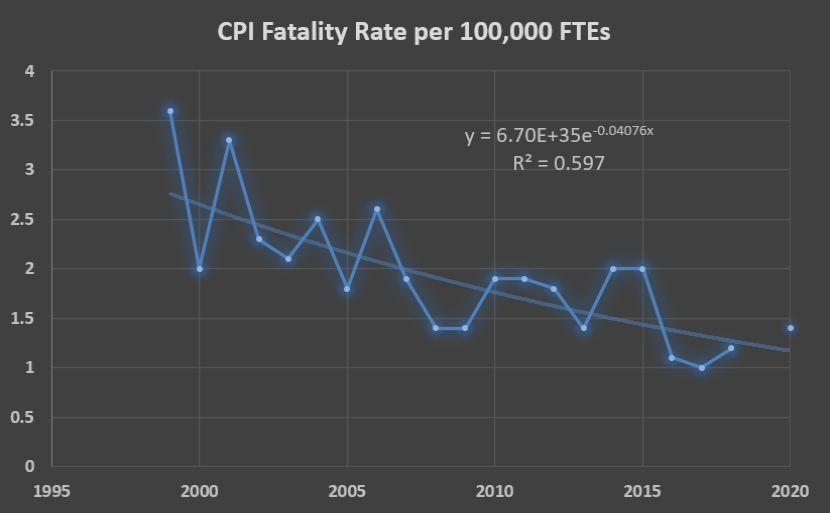
While the NHTSA does a good job of compiling and sharing traffic safety data, it is the Department of Labor and its Bureau of Labor Statistics that compile and share data about industrial safety. Instead of data going back to the nineteenth century, we have data for the chemical process industries that goes back to 1999. If we were inclined, we could look to 2004, the year that the International Electrotechnical Commission issued the IEC 61511, the standard for safety instrumented system, but we would see no correlation with process safety as reflected in fatality rates in the CPI.
I wish we could go back and look at before and after 1992, the year that OSHA promulgated the Process Safety Management standard, and look for a correlation of PSM to the fatality rate in the CPI. But the data is not readily available that far back. However, traffic safety data suggests that it would be a pointless exercise in any case. What matters is not one change that made all the difference, but a continued effort to improve.
It is clear from the 20 years of data that we have that we are improving. We just have to keep at it, knowing that in some years there will be setbacks, and, in some years, there will be advances, but that over the course of time, we are getting better.
Take Heart—We’re Getting Safer
So, take heart. Our efforts are making a difference. Incidents still occur, and they will continue to occur, but thanks to the commitment of everyone in the CPI, they happen less often, and when they happen, they are less severe. Keep at it. There will not be one big step change that eliminates all hazards from the CPI, but a continuous stream of incremental improvements that will drive our industry to be safer and safer.