“It’s no good crying over spilt milk, because all the forces of the universe are bent on spilling it.” —William Somerset Maugham
Imagine a tank truck shows up at your plant.
It’s there to make a delivery or to pick up a load. Perhaps it had to wait overnight in your lot before your shipping department could spot it at a loading or unloading station. The load stations are curbed and contained, so any spill or leak while loading is captured and not released to the environment.
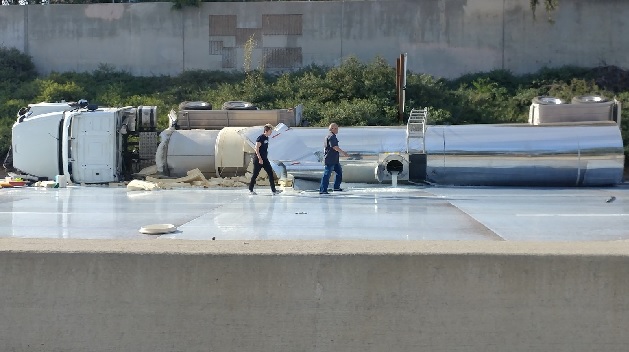
Somewhere between the public roadway and your carefully contained loading spot, however, the truck releases part of its load in your plant.
Since it is at your site, it is your release.
How worried should you be?
Leaks and Spills
There are two types of releases from tank trucks. One is a leak, where a mechanical fault results in a slow, steady release of material. The other is a spill, where a truck crash results in a sudden, noticeable release of material.
Because leaks and spills typically involve trucks and drivers that are not the plant’s, it is easy to despair of doing anything about either leaks or spills. Like bad weather, however, you may not be able to prevent them, but you can plan for them. It helps, though, to first know the frequency at which to expect both leaks and spills.
Leaking Tank Trucks
The Air Resources Board (ARB) of the California Environmental Protection Agency (CalEPA) conducted a study of its leak rate standard in 2007. Then, in 2008, 2009, and 2010, the ARB Enforcement Division reported liquid leak violations in its Annual Enforcement Report. It stopped reporting that detail beginning with the 2011 report.
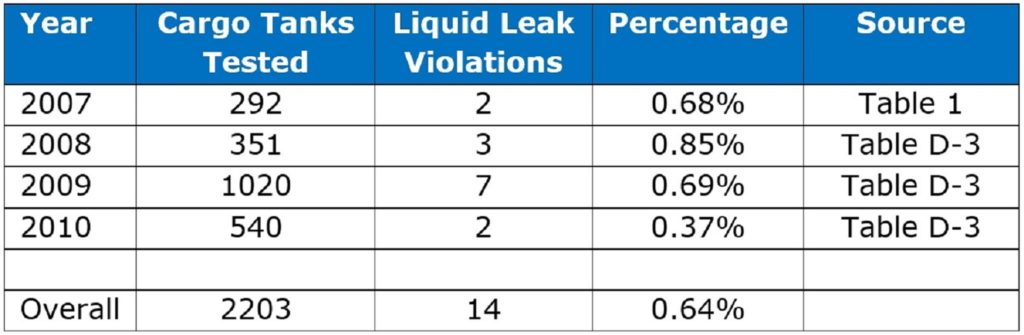
In CalEPA’s inspections, almost 1% of tank trucks leaked. CalEPA’s criterion for a leak is more than 3 drops per minute. At 20 drops per ml, a truck with a leak as defined by CalEPA will leak 0.06 gallons if it is on site for a day.
As the criterion for a leak gets larger, what is considered a leak becomes less frequent. Using a decimal distribution, we can estimate the frequency. If 1% of tank trucks leak 0.06 gallons in a day, then 0.1% of tank trucks can be expected to leak 0.6 gallons in a day. Likewise, 0.01% of tank trucks can be expected to leak 6 gallons in a day and 0.001% of tank trucks can be expected to leak 60 gallons in a day. Beyond that, we’re no longer talking about leaks.
Releases from Truck Crashes
In addition to the number of tank trucks that are on site, there are several factors to account for when estimating the frequency at which in-plant truck crashes result in releases:
- The probability that a particular tank truck will be involved in a crash during the year.
- The probability that the crash of that particular tank truck will be in a non-traffic environment, such as a parking lot.
- The probability that the non-traffic environment in which that particular tank truck crashes happens to be your facility.
- The probability that the crash of that particular tank truck results in a release.
- The probability that the release will be a significant quantity.
Most of the data for the analysis that follows is taken from Large Truck and Bus Crash Facts 2016, the most current edition of a report that the Federal Motor Carrier Safety Administration (FMCSA) issues each year.
Trucks involved in a crash. In 2016, there were 12,474,722 trucks registered in the U.S. The same year, 572,440 trucks were involved in crashes that resulted in fatalities, injuries, or property damage.
So, there is about a 5% probability that any truck that shows up at your plant will be involved in crash this year.
Crash in a Non-Traffic Environment. A non-traffic environment is one that is not a road or highway. The most common example is a parking lot, but non-traffic environments include any private property where vehicles move or park. An often-published statistic is that “20% of crashes happen in parking lots”.
The FMCSA doesn’t look at crashes in parking lots, but it does look at collisions with fixed objects, parked motor vehicles, and with other objects. Of 502,213 crashes (there are more trucks in crashes than there are crashes because some crashes involve more than one truck), 88,256 were crashes with fixed objects, parked motor vehicles, and with other objects; in non-traffic environments. This is 17.6% of all truck crashes, confirming the 20% statistic quoted for all vehicles.
So, there is a 20% probability that a truck that is in a crash this year will be in that crash in a parking lot. In other words, there is a 1% probability that any truck that shows up at your plant will be involved in crash in a parking lot this year.
Non-Traffic Environment is Your Plant. Just because a truck is in a crash in a parking lot doesn’t mean that it will be in your parking lot. The FMCSA doesn’t publish data about how many non-traffic environments a truck visits on average, but a few conversations with truck drivers suggests that seven parking lots per day, 250 days per year is a conservative estimate. This means that if a truck is in a parking lot crash during the year, there is a 1/1750, or 0.06% probability that it is while in your parking lot.
Another way to look at this is to compare the amount of time a truck spends at your plant during a pick-up or delivery with the total time that truck spends in non-traffic environments during the year.
At your plant for one visit: 4 hr.
Total time in traffic during the year: 8 hr/day x 250 day per yr = 2000 hr/yr
Total time in non-traffic during the year: 8760 hr/yr – 2000 hr/yr = 6770 hr/yr
Percentage of non-traffic time in your plant, per year: 4 hr/6770 hr = 0.06%
So, each visit to your site accounts for about 0.06% of the time a tank truck spends in non-traffic environments. In other words, there is a 0.0006% probability that any truck that shows up at your plant will be involved in a crash while there.
Crash Results in a Release. The FMCSA keeps track of crashes involving hazardous materials. It parses the data several different ways, but we are only interested in crashes for which there is data about whether there was a liquid release or not. Those would include all cargos of flammable liquids and corrosives, and some of the crashes involving cargos of oxidizing substances, poisonous and infectious substances, and miscellaneous dangerous goods. In 2016, there were about 1,940 such crashes, of which 375 resulted in a release, or about 20%.
So, a tank truck hauling hazardous material that is involved in a crash has about a 20% releasing some of its load. In other words, there is a 0.00012% probability that a specific tank truck that shows up at your plant will be involved in a crash that results in the release of material on your site.
Release is Significant. Not all releases are significant. While CalEPA defines a leak as more than 3 drops per minute, emergency responders are not looking for drops. They are looking for noticeable quantities. We can assume that all leaks are greater than 0.6 gallons. Using the same approach described for leaks, then, we can estimate probability of the leaks being larger:
≥ 0.6 gallons 100% of all releases
≥ 6 gallons 10% of all releases
≥ 60 gallons 1% of all releases
≥ 600 gallons 0.1% of all releases
≥ 6000 gallons 0.01% of all releases
So, if the release of a drum quantity is significant, then 1% of all releases from a truck crash with be significant. In other words, there is a 0.0000012% probability—a 1 in 80 million chance—that a specific tank truck that shows up at your plant will be involved in a crash that results in the release of a drum or more of material on your site.
Truck Traffic Matters
The estimates above are on a per truck basis. The total risk is not on a per truck basis, but for the site.
For a hypothetical plant that has a thousand tank trucks on site each year—4 trucks per weekday—with a typical stay of a day, they can expect about 10 leaks a year of 0.06 gallons or more, about 1 leak a year of 0.6 gallons or more, about 1 leak every decade bigger than a 5-gallon pail, and about 1 leak per century that is more than a drum.
For that same hypothetical plant with a thousand tank trucks on site each year, they can expect an in-plant truck crash resulting in a release of 0.6 gallons or more about once every 800 years, an in-plant truck crash resulting in a release of 6 gallons or more about once every 8,000 years, an in-plant truck crash resulting in a release of 60 gallons or more about once every 80,000 years, and an in-plant truck crash resulting the release of the entire truck load about once every 8 million years.
Whether this represents a high risk or a low risk will depend a great deal on what is being released.
If You Must Do Something
For many, the risk of a tank truck leak or spill away from the load spot is low enough that no additional action is required. Leaks or spills at load spots, on the other hand, are different, and deserve the extra attention that they already receive. Before undertaking a project to contain leaks or spills in parking lots and travel lanes, make sure that the containment at load spots is adequate.
Then and only then, consider whether there are measures to reduce the likelihood of tank truck crashes while they are on site. The reason for crashes in non-traffic environments is that drivers are focused on finding their destination and tend to overlook other vehicular traffic. As a result, they tend to drive faster than conditions warrant, in an area that is typically very congested. Designing travel lanes that discourage speeding will reduce the potential for crashes, as will the use of pilot vehicles to guide and regulate traffic into and out of the facility.
Lastly, consider whether more extensive containment is warranted.